ElasticStack 最初的核心是 ELK (Elasticsearch, Logstash, Kibana) ,后又新增了一个FileBeat。
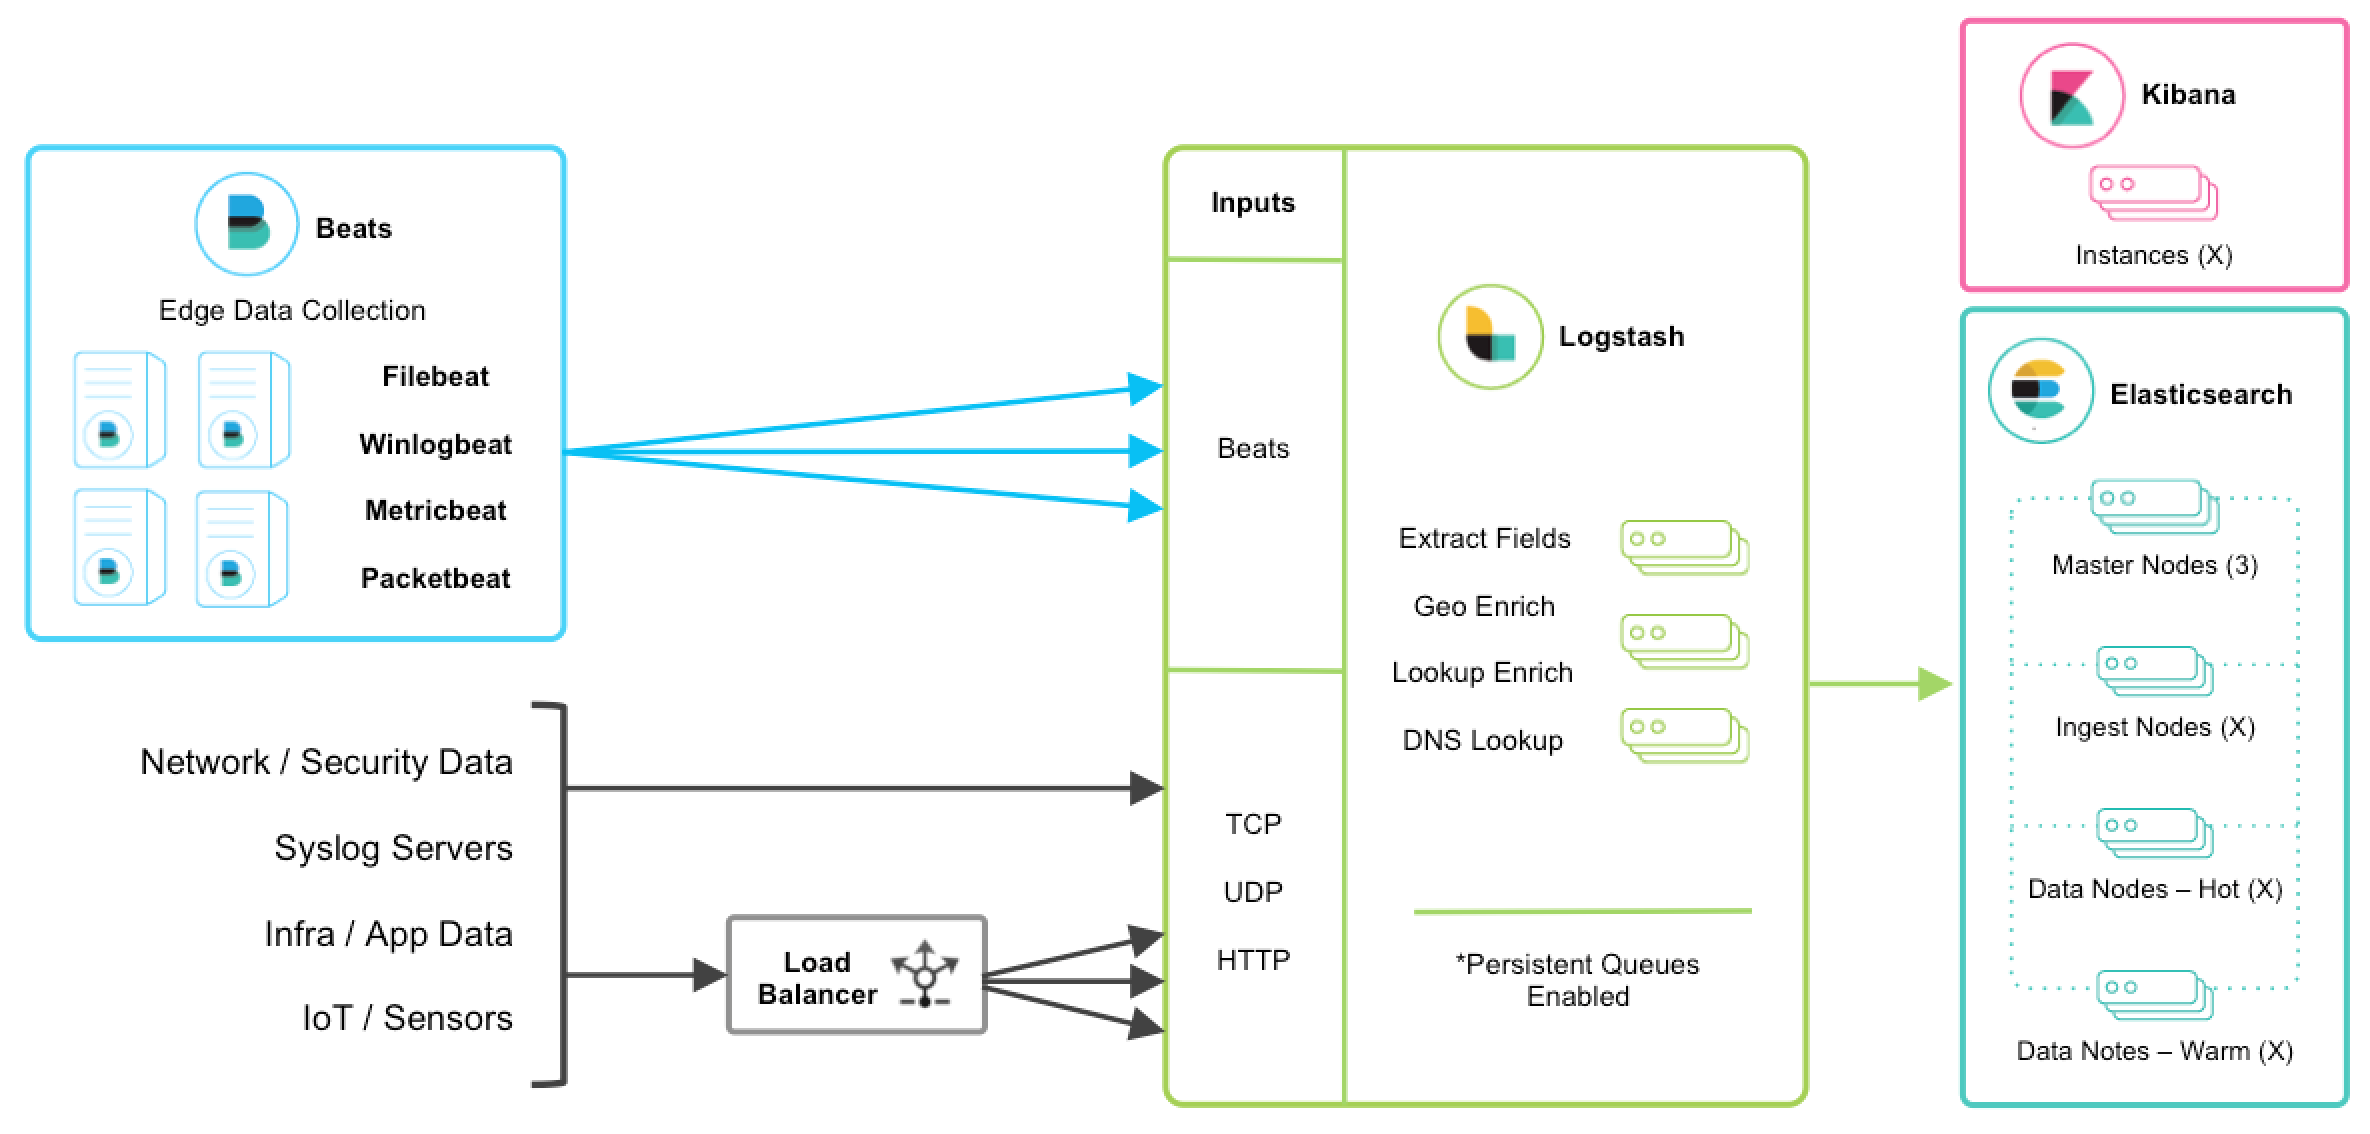
ELK架构
- Elasticsearch :分布式搜索引擎。基于 Lucene,可用于全文检索、结构化检索和分析。
- Logstash :数据收集处理引擎。支持动态搜集数据,处理、存储数据。
- Kibana :可视化平台。能够搜索、展示存储在 Elasticsearch 中索引数据。
- Filebeat :轻量级数据收集引擎。隶属于Beats,替代原先的 Logstash-fowarder 。
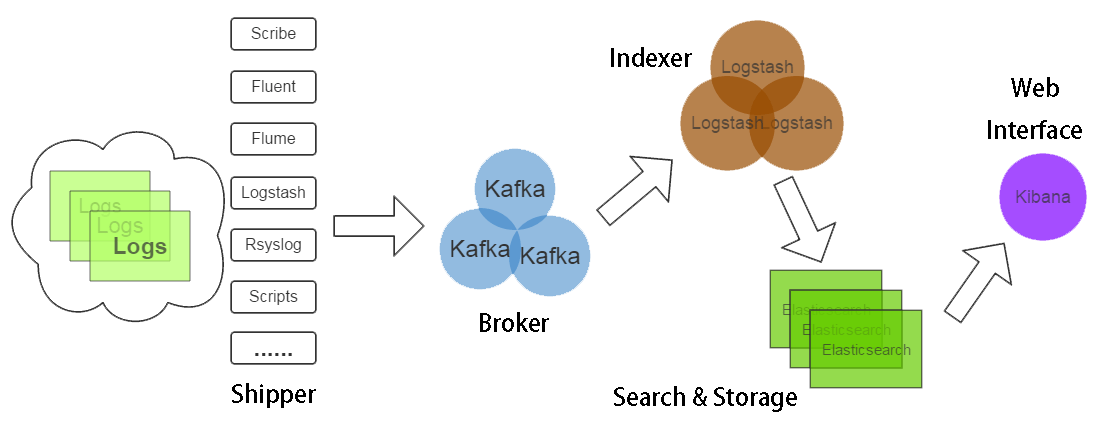
日志分析平台流程
- 把分散在各个机器的日志汇总到一个地方(Shipper, Broker, Indexer)
- 把这些日志用某种方式保存并索引起来(Search & Storage)
- 需要的时候直接在汇总的日志中查询(Web Interface)
环境搭建
ELK依赖JDK
ELK下载:https://www.elastic.co/downloads/
安装 Elasticsearch
- 官网下载解压。
- 安装Head插件,可以通过localhost:9200/_plugin/head查看集群状态
./bin/plugin install mobz/elasticsearch-head
- 编辑配置文件elasticsearch.yml
cluster.name=es_cluster
node.name=node0
path.data=/tmp/elasticsearch/data
path.logs=/tmp/elasticsearch/logs
network.host=centos2
network.port=9200
- 运行 bin/elasticsearch (Windows 上运行 bin\elasticsearch.bat)启动
- 验证运行成功:REST 访问访问 http://localhost:9200/
安装 Logstash
- 官网下载解压。
- 添加logstash.conf,指定Input和Output及插件,以log4j输入和ElasticSearch输出为例:
input {
  log4j {

    mode => "server"

    host => "localhost"

    port => 4567

  }
}
filter {
  #Only matched data are send to output.
}
output {
    elasticsearch {
        action => "index"
        hosts => ["localhost:9200"]
        index  => "applog"
    }
}
- 运行 bin/logstash -f logstash.conf (Windows 上运行bin/logstash.bat -f logstash.conf)
安装 Kibana
- 官网下载解压。
- 修改 config/kibana.yml 配置文件,设置 elasticsearch.url 指向 Elasticsearch 实例。
server.port: 5601
server.host: “localhost”
elasticsearch.url: http://localhost:9200
kibana.index: “.kibana”
- 运行 bin/kibana (Windows 上运行 bin\kibana.bat)启动
- 在浏览器上访问 http://localhost:5601
安装 Filebeat
- 官网下载解压。
curl -L -O https://artifacts.elastic.co/downloads/beats/filebeat/filebeat-5.1.1-x86_64.rpm
sudo rpm -vi filebeat-5.1.1-x86_64.rpm
- 配置filebeat.yml input
filebeat.prospectors:
- input_type: log
  paths:
    - /apps/logs/*/info.log
- 配置filebeat.yml output
output.logstash:
  hosts: ["127.0.0.1:5044"]
- 启动filebeat
sudo /etc/init.d/filebeat start
工作原理
Filebeat工作原理
Filebeat由两个主要组件组成:prospectors 和 harvesters。这两个组件协同工作将文件变动发送到指定的输出中。

-
Harvester(收割机) :负责读取单个文件内容。
对每个文件,启动一个Harvester,逐行读取文件内容,并发送到指定输出中。
如果文件在Harvester运行的时候被重命名或者被删除,Filebeat会继续读取此文件,在Harvester关闭之前,磁盘不会被释放。默认情况filebeat会保持文件打开的状态,直到达到close_inactive(如果此选项开启,filebeat会在指定时间内将不再更新的文件句柄关闭,时间从harvester读取最后一行的时间开始计时。若文件句柄被关闭后,文件发生变化,则会启动一个新的harvester。关闭文件句柄的时间不取决于文件的修改时间,若此参数配置不当,则可能发生日志不实时的情况,由scan_frequency参数决定,默认10s。Harvester使用内部时间戳来记录文件最后被收集的时间。例如:设置5m,则在Harvester读取文件的最后一行之后,开始倒计时5分钟,若5分钟内文件无变化,则关闭文件句柄。默认5m)。 -
Prospector(勘测者):负责管理Harvester并找到所有读取源。
Prospector会找到/apps/logs/*目录下的所有info.log文件,并为每个文件启动一个Harvester。Prospector会检查每个文件,看Harvester是否已经启动,是否需要启动,或者文件是否可以忽略。若Harvester关闭,只有在文件大小发生变化的时候Prospector才会执行检查。只能检测本地的文件。
Filebeat如何记录文件状态:
将文件状态记录在文件中(默认在/var/lib/filebeat/registry)。此状态可以记住Harvester收集文件的偏移量。若连接不上输出设备,如ES等,filebeat会记录发送前的最后一行,并再可以连接的时候继续发送。Filebeat在运行的时候,Prospector状态会被记录在内存中。Filebeat重启的时候,利用registry记录的状态来进行重建,用来还原到重启之前的状态。每个Prospector会为每个找到的文件记录一个状态,对于每个文件,Filebeat存储唯一标识符以检测文件是否先前被收集。
Filebeat如何保证事件至少被输出一次:
Filebeat之所以能保证事件至少被传递到配置的输出一次,没有数据丢失,是因为filebeat将每个事件的传递状态保存在文件中。在未得到输出方确认时,filebeat会尝试一直发送,直到得到回应。若filebeat在传输过程中被关闭,则不会再关闭之前确认所有时事件。任何在filebeat关闭之前为确认的时间,都会在filebeat重启之后重新发送。这可确保至少发送一次,但有可能会重复。可通过设置shutdown_timeout 参数来设置关闭之前的等待事件回应的时间(默认禁用)。
Logstash工作原理
Logstash事件处理有三个阶段:inputs → filters → outputs。是一个接收,处理,转发日志的工具。
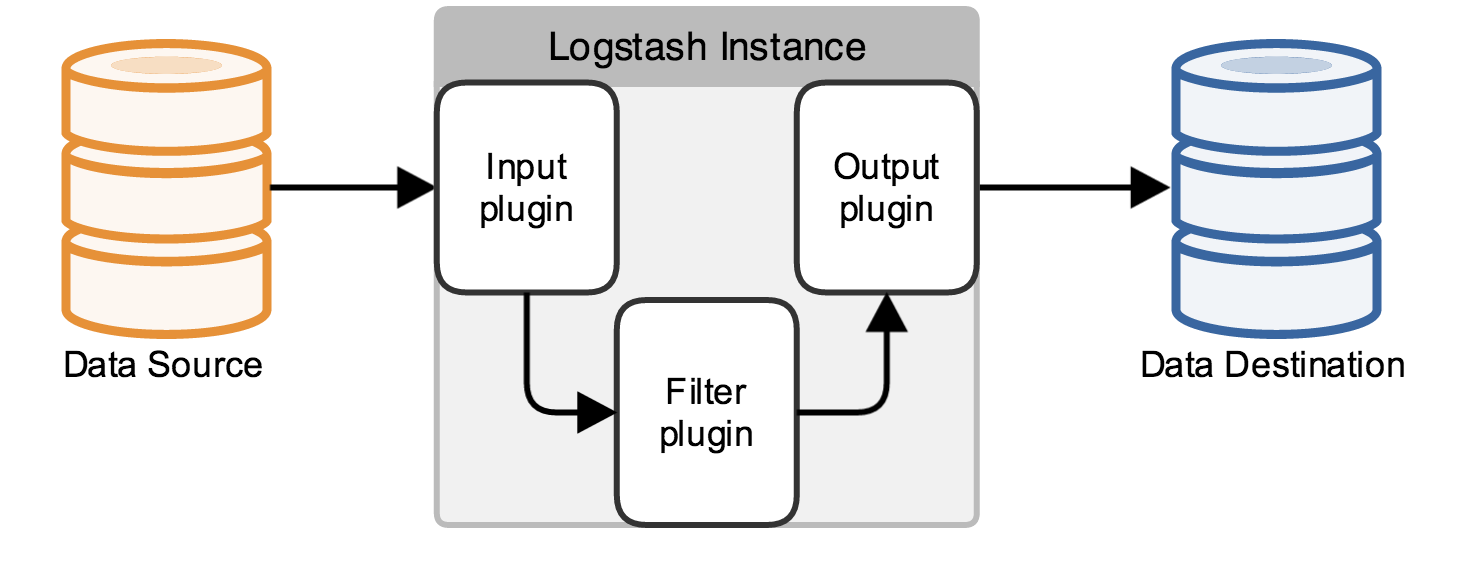
Input:输入数据到logstash。
一些常用的输入为:
- file:从文件系统的文件中读取,类似于tial -f命令
- syslog:在514端口上监听系统日志消息,并根据RFC3164标准进行解析
- redis:从redis service中读取
- beats:从filebeat中读取
Filters:数据中间处理,对数据进行操作。
一些常用的过滤器为:
- grok:解析任意文本数据,Grok 是 Logstash 最重要的插件。它的主要作用就是将文本格式的字符串,转换成为具体的结构化的数据,配合正则表达式使用。内置120多个解析语法。
官方提供的grok表达式:https://github.com/logstash-plugins/logstash-patterns-core/tree/master/patterns
grok在线调试:https://grokdebug.herokuapp.com/ - mutate:对字段进行转换。例如对字段进行删除、替换、修改、重命名等。
- drop:丢弃一部分events不进行处理。
- clone:拷贝 event,这个过程中也可以添加或移除字段。
- geoip:添加地理信息(为前台kibana图形化展示使用)
Outputs:outputs是logstash处理管道的最末端组件。一个event可以在处理过程中经过多重输出,但是一旦所有的outputs都执行结束,这个event也就完成生命周期。
一些常见的outputs为:
- elasticsearch:可以高效的保存数据,并且能够方便和简单的进行查询。
- file:将event数据保存到文件中。
- graphite:将event数据发送到图形化组件中,一个很流行的开源存储图形化展示的组件。
Codecs:codecs 是基于数据流的过滤器,它可以作为input,output的一部分配置。Codecs可以帮助你轻松的分割发送过来已经被序列化的数据。
一些常见的codecs:
- json:使用json格式对数据进行编码/解码。
- multiline:将汇多个事件中数据汇总为一个单一的行。比如:java异常信息和堆栈信息。